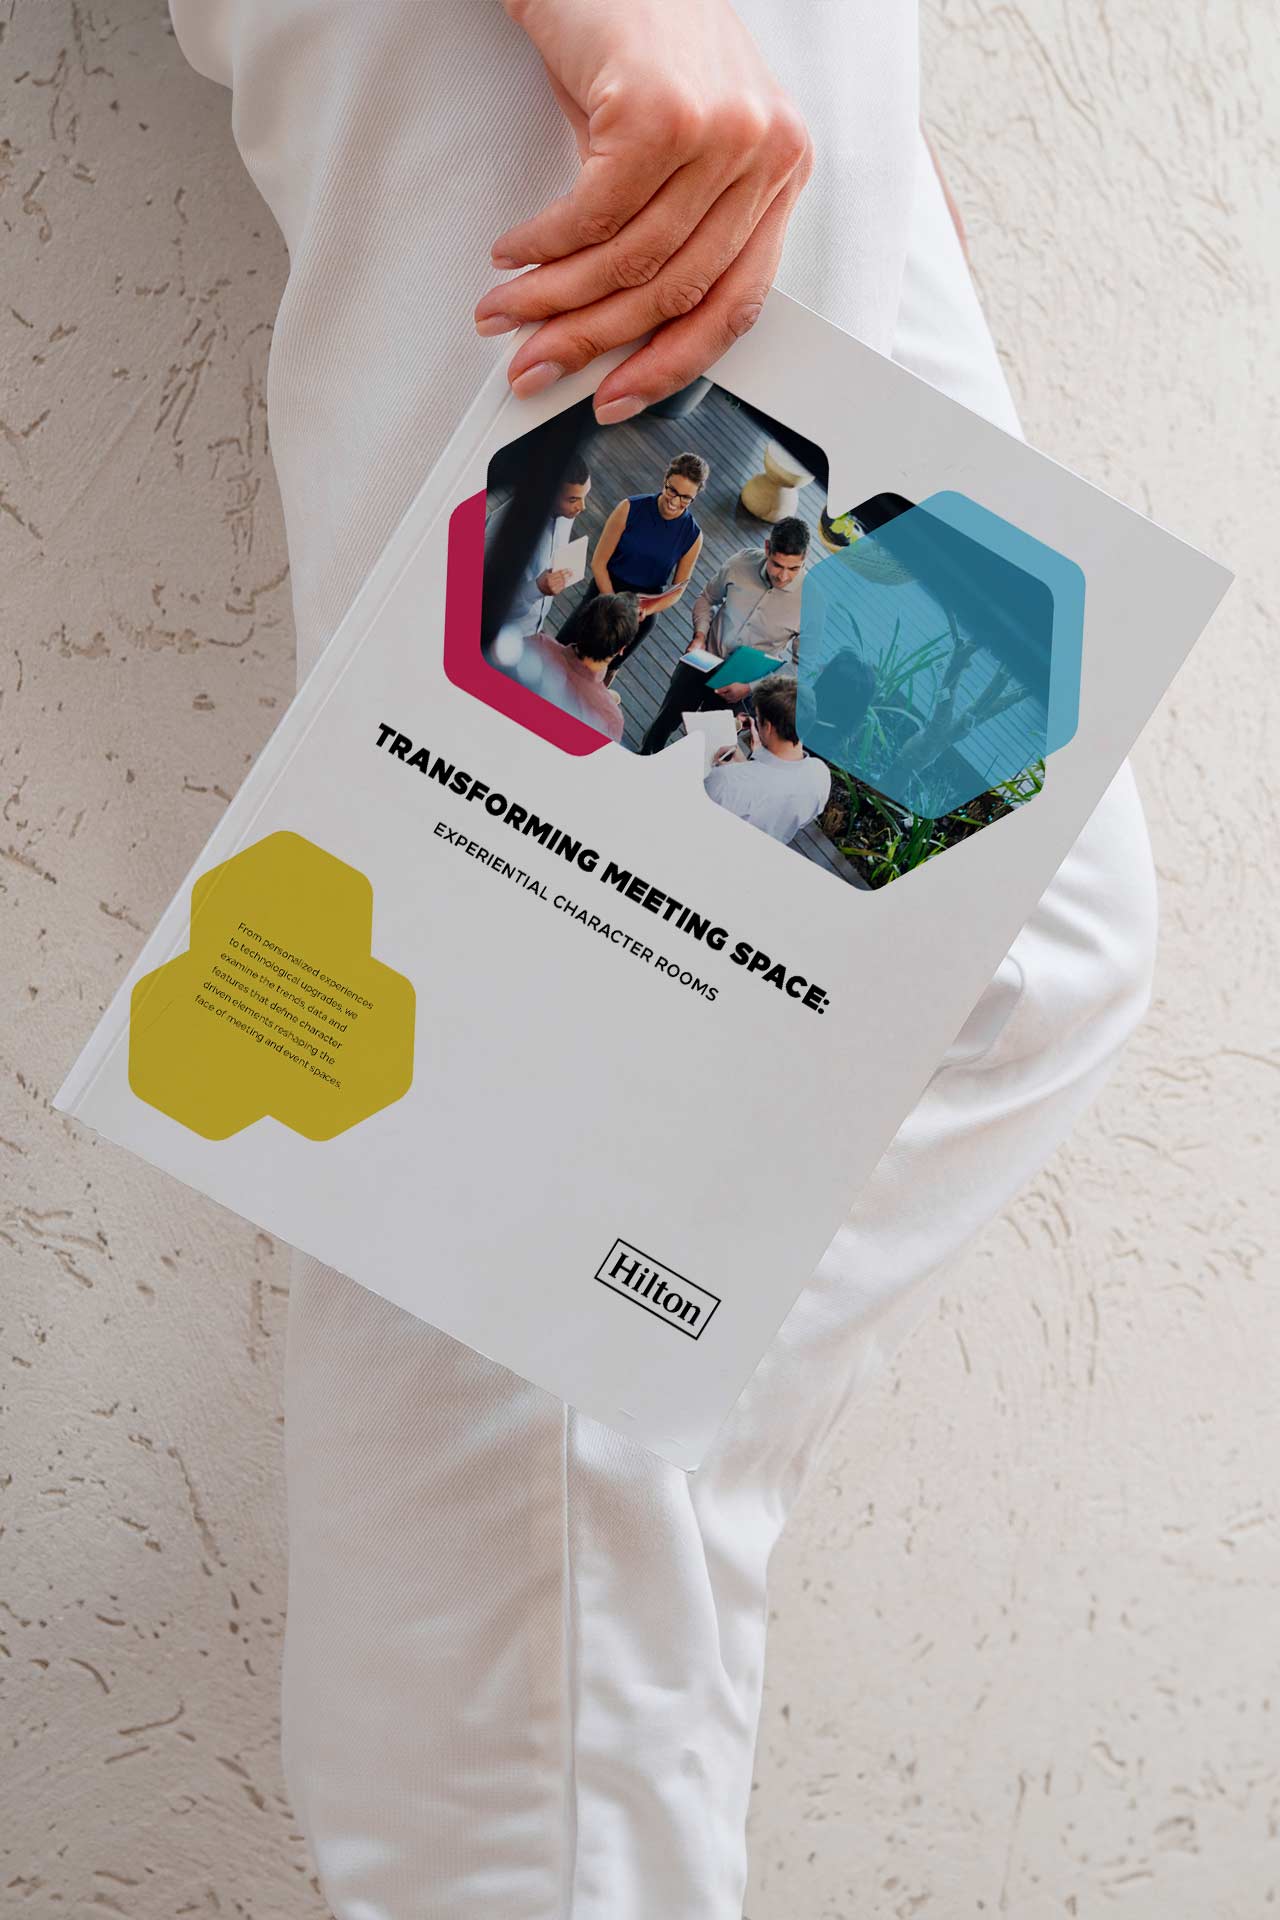
Your annual reports design, financial statement paper, and impact documents don’t have to be mere repositories of data. In the fast-changing world of corporate communication, we’re seeing these critical documents undergo a creative revolution. By integrating infographics, immersive visuals, and interactive elements, they’re transformed into engaging narratives that not only convey essential information but also enhance stakeholder engagement and clarity.

Let me guide you on how to turn your report into a delightful part of your brand’s experience, moving it away from being just another piece of year-end collateral that gathers dust—let’s craft the perfect annual report that engages the reader.
Gone are the days when these important documents were bound by formality and packed with data. Thanks to technological advancements and a dash of creativity, we’re steering towards a significant makeover. Leading the way with innovative graphic design techniques, we’re tackling the complex challenge of presenting financial data and narratives in a manner that’s not only engaging but also easily accessible. This journey from mere information sharing to creating captivating and enlightening experiences demonstrates the powerful ways in which creativity and technology are revolutionizing how companies share their annual achievements and visions.
In the realm of corporate communication, financial and annual reports are essential tools for conveying a company’s performance and strategy to stakeholders. However, the challenge lies in presenting complex financial data and narratives in a way that is both engaging and accessible. As we delve into the future of report design, leveraging innovative design techniques becomes crucial in transforming these documents into compelling pieces. Discover the latest design techniques that can elevate your reports to the next level. Learn how to captivate your audience with clear and engaging visuals that are not only functional but also aesthetically pleasing.
Data Visualization Mastery
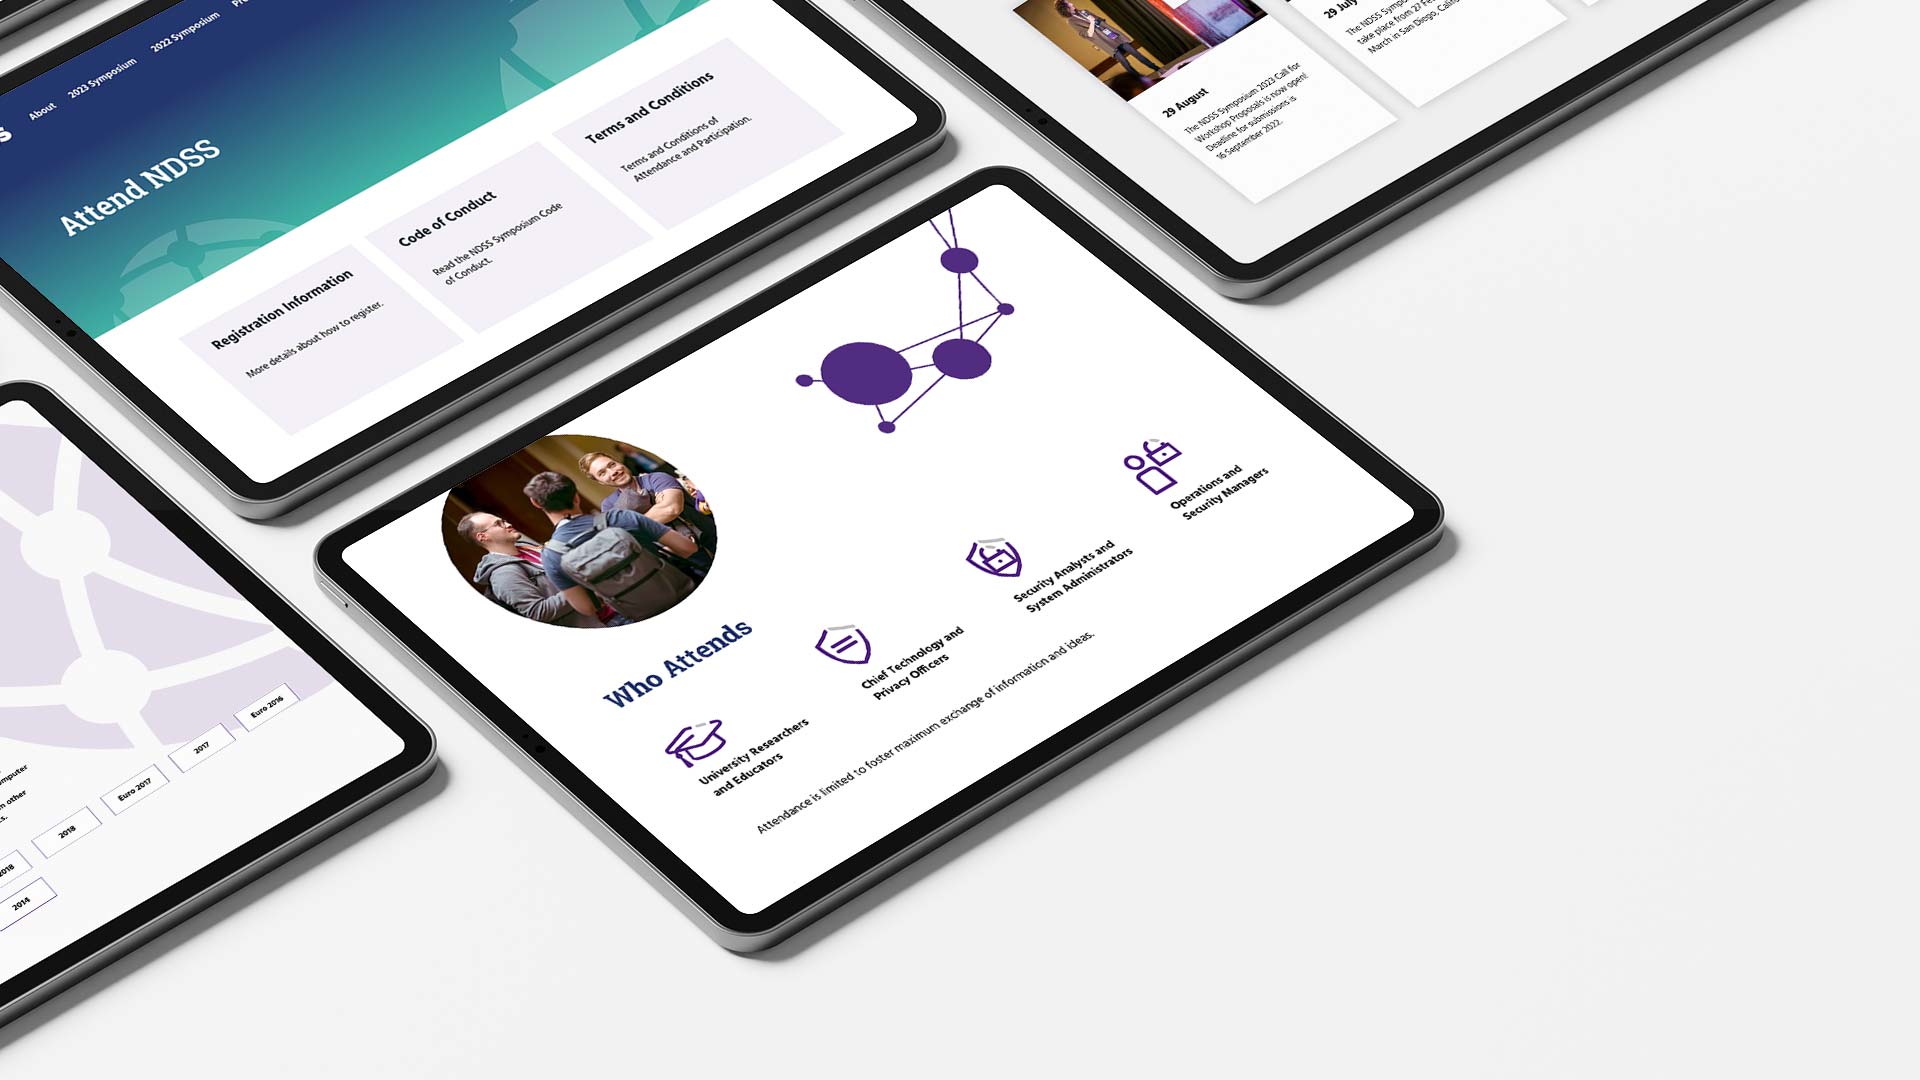
The power of data visualization cannot be overstated in financial and annual report design. Moving beyond traditional charts and graphs, designers are now employing dynamic visualization techniques to bring data to life. Interactive elements, such as animated charts and scroll-triggered animations in digital reports, offer readers a more engaging experience. Advanced visualization tools, including heat maps, sankey diagrams, and treemaps, can illustrate complex data in an intuitive manner, making it easier for stakeholders to grasp key financial insights at a glance.
Dynamic graphs and charts illustrations represent the forefront of engaging report design, acting as a bridge between raw data and the reader’s understanding. These elements transform static numbers into visual narratives, allowing stakeholders to see trends, patterns, and outliers at a glance. For instance, animated line charts can show the growth of revenue over time, not just as a snapshot but as a story unfolding. Similarly, interactive bar graphs invite users to explore different segments of data, offering insights into various aspects of business performance with just a click or hover.

The real magic lies in customization and interactivity. Custom-designed charts that align with your brand’s aesthetic make your report visually cohesive and memorable. Meanwhile, interactivity ensures that the data speaks directly to the stakeholders’ interests, allowing them to engage with the information that matters most to them. This level of engagement is crucial in digital reports, where the attention of the reader is at a premium.
Moreover, incorporating dynamic elements into reports does more than just beautify them; it democratizes data, making it accessible to a broader audience regardless of their expertise in financial analysis. By simplifying complex information through visual storytelling, brands can foster a deeper awareness and appreciation of their performance and strategy among stakeholders, enhancing transparency and trust.
Storytelling Through Design
Every company has a unique story to tell, and the annual report is the perfect medium to narrate this journey. Integrating storytelling elements into the design can transform dry statistics and achievements into a compelling narrative. This can be achieved through the strategic use of typography, color, and imagery that aligns with the company’s brand and culture. Custom illustrations and thematic design elements can weave a visual story that guides the reader through the report, enhancing the emotional connection and reinforcing the company’s identity.
Immersive Digital Experiences
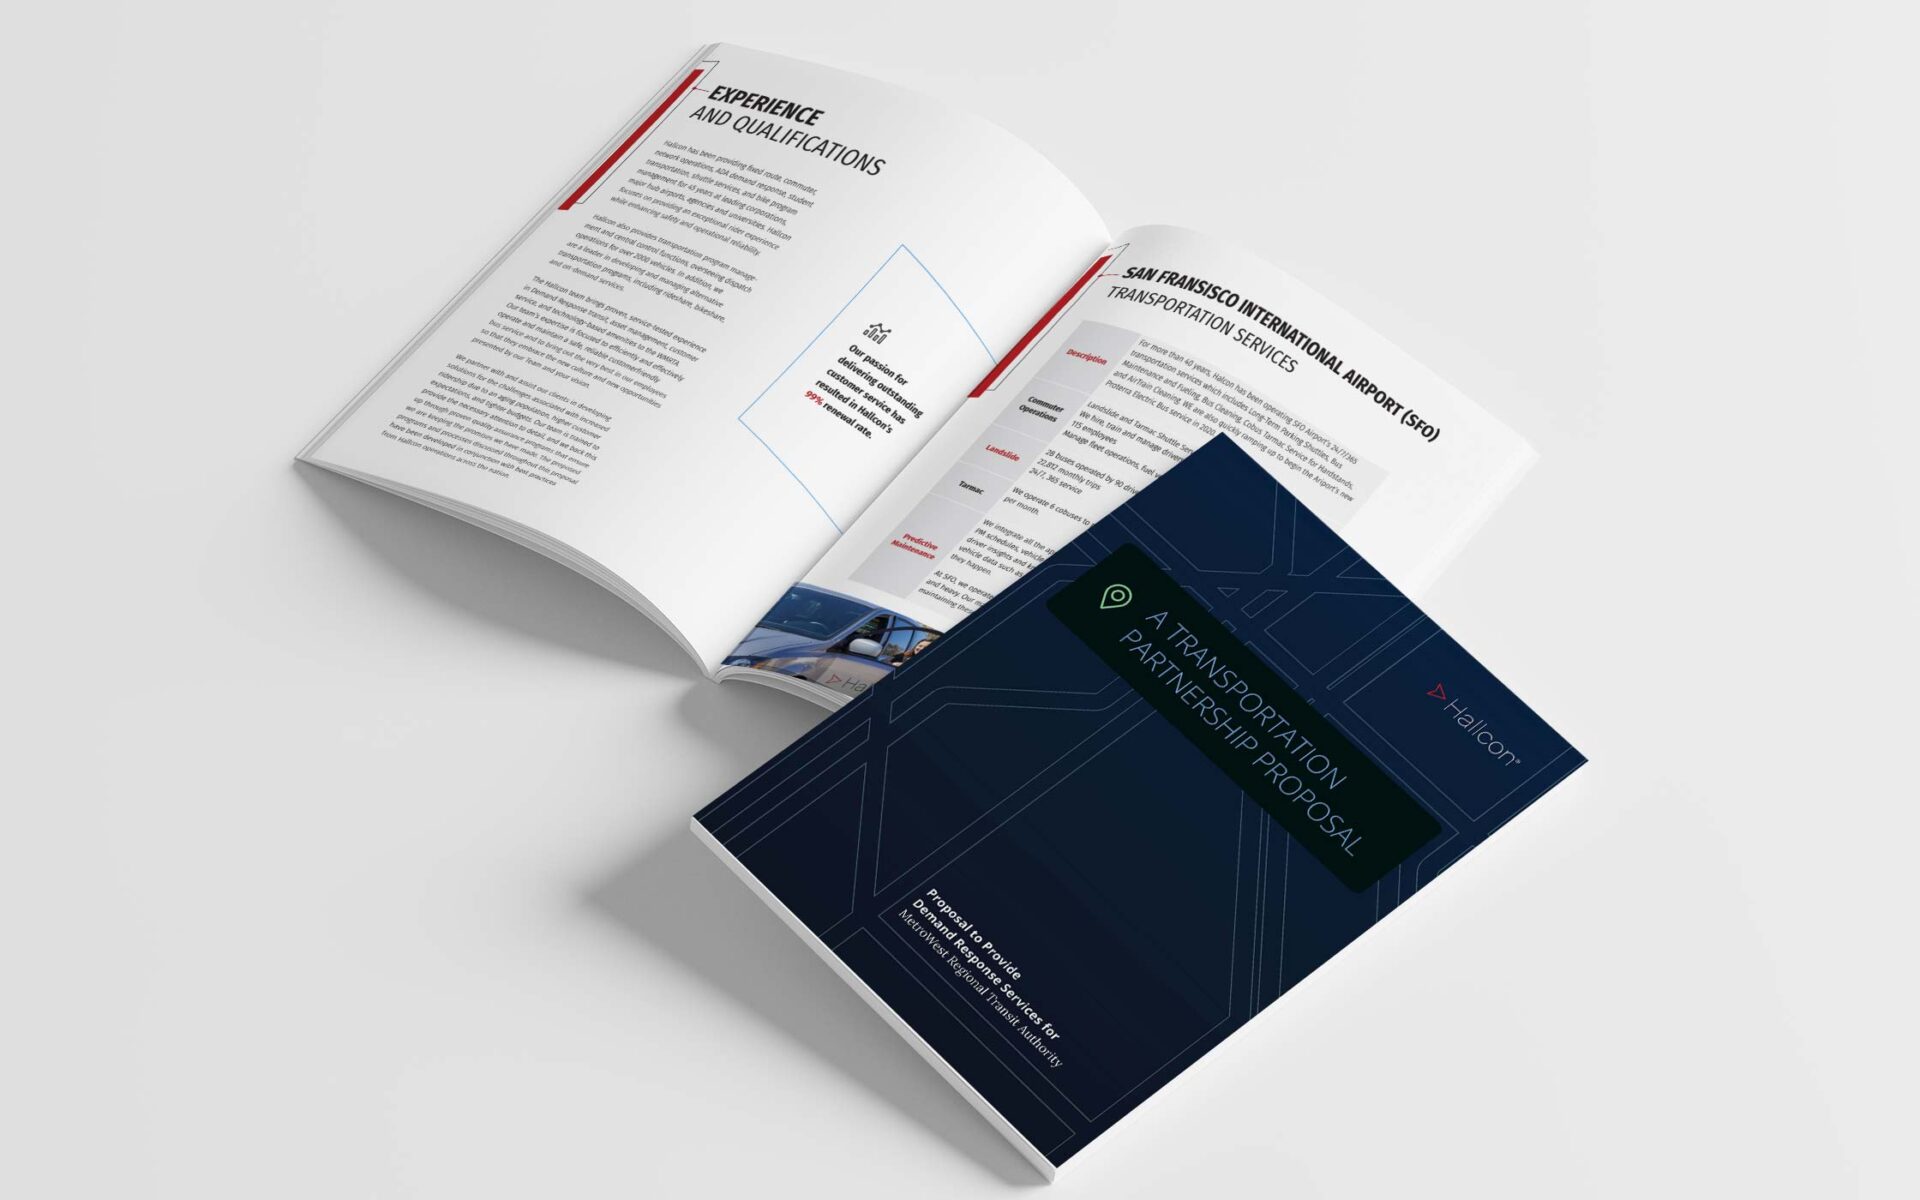
As digital reports become more prevalent, there is a growing opportunity to create immersive experiences that captivate readers. Incorporating multimedia elements such as video messages from the CEO, audio clips, and virtual reality tours can provide a more dynamic and personal insight into the company. These elements, combined with interactive data visualizations, ensure that the digital annual report is not just a document, but an engaging journey through the company’s yearly performance and future outlook.
As an art director, I believe that the key to creating engaging digital reports is by prioritizing storytelling that connects with your audience. At Artversion, we always begin our work with a personality audit of the organization. This helps us ensure that both the narrative and visuals stay true to the brand’s identity and reflect its authenticity. By doing this, we can create reports that resonate more with the intended audience, leading to greater success. Remember, every chart, every video, and every piece of interactive content should contribute to the narrative arc of your company’s journey over the past year. It’s about weaving a story that not only presents data but also humanizes your brand and makes complex information relatable. Don’t shy away from using creative visual metaphors and thematic design elements that align with your brand’s message. This approach not only enriches the user experience but also reinforces your brand identity throughout the report, making it a memorable piece that stakeholders look forward to engaging with year after year.
Sustainable Design Practices
Sustainability is increasingly becoming a priority for companies and their stakeholders. This shift is reflected in the design and production of financial and annual reports. Utilizing eco-friendly materials, such as recycled paper and soy-based inks for printed reports, demonstrates a commitment to sustainability. For digital reports, designers are optimizing file sizes and formats to reduce energy consumption during viewing. These practices not only minimize the environmental impact but also resonate with eco-conscious stakeholders.
Modular Layouts for Customization
The adoption of modular design layouts allows for greater flexibility and customization of content, catering to diverse stakeholder preferences. Modular layouts enable readers to navigate through sections of interest more efficiently, whether in print or digital formats. This approach also facilitates the repurposing of sections for different mediums, such as social media posts, newsletters, and presentations, ensuring a consistent message across all communication channels.
In closing, the evolution of financial and annual report design is not just a trend; it’s a testament to the power of creativity and technology in transforming how companies communicate with their stakeholders. As we push the boundaries of what these reports can be—shifting from static documents to dynamic, interactive narratives—we invite readers on a journey that goes beyond numbers and charts. This is an opportunity to deepen connections, foster transparency, and illuminate the path forward with clarity and purpose. Let’s embrace these innovative design techniques to craft reports that don’t just inform, but inspire and engage. Here’s to turning the page on the traditional annual report and stepping into a future where every figure tells a story, and every page sparks imagination.
Discover Print and Report Design Excellence with ArtVersion
Looking to elevate your print materials and reports with design that captivates and communicates? ArtVersion is your go-to agency for innovative print and report design solutions that bridge the gap between information and engagement. Specializing in creating visually stunning and strategically crafted reports, we ensure your print materials not only convey your company message but also embody your brand’s essence and connect with your audience on a deeper level.
Reach out to ArtVersion to discuss your next print design project. Let us show you how our bespoke design solutions can enhance your communication strategy and leave a lasting impression on your stakeholders. We’re passionate about bringing design and content together in innovative ways and are excited to partner with you on your design journey.
Contact us to start a conversation about your report and print design needs. Together, we can create print materials that not only inform but inspire.
